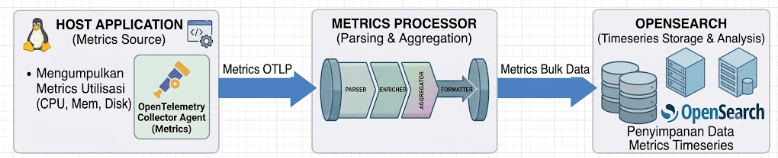
Artikel ini membagikan menjadikan OpenSearch sebagai database timeseries untuk menampung data metrics utilisasi seperti halnya prometheus lakukan, data utilisasi tersebut berasal dari OpenTelemetry Collector, sebelumnya sudah ada artikel untuk mengirim metrics OpenTelemetry ke Opensearch tetapi data yang sampai di index opensearch masih dalam berbentuk raw.
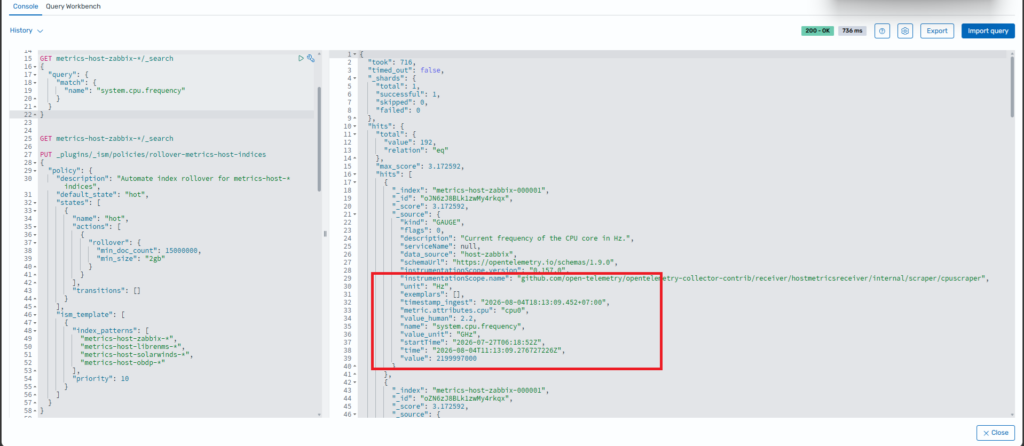
Sebagai contohnya untuk satuan CPU Frequency satuan yang diterima oleh index Opensearch satuannya dalam bentuk hz seperti gambar dibawah.
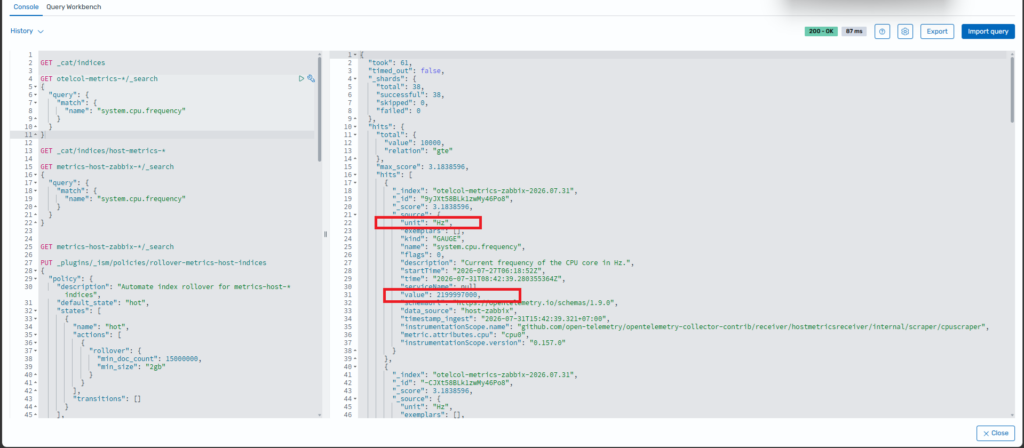
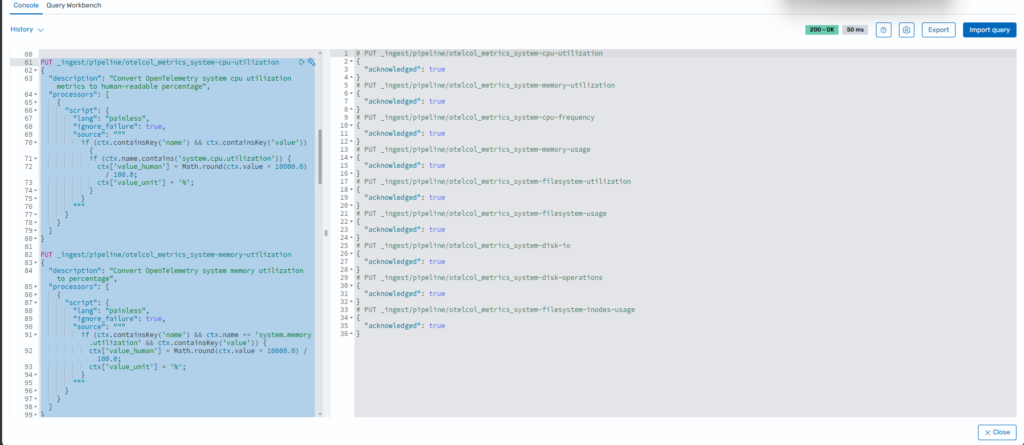
Perlu ditambahkan konfigurasi ingest pipeline untuk melakukan perhitungan atau convert agar bisa sesuai dengan yang kita inginkan atau agar data nya jadi lebih mudah dibaca.
Sebagai usecase, saya ingin mengambil metrics dari host zabbix yang mana utilisasi host zabbix tersebut akan dikirimkan ke index OpenSearch, contohnya nanti kita bisa buat sebagai data forcast untuk host tersebut.
Table of Contents
Membuat Index Policy
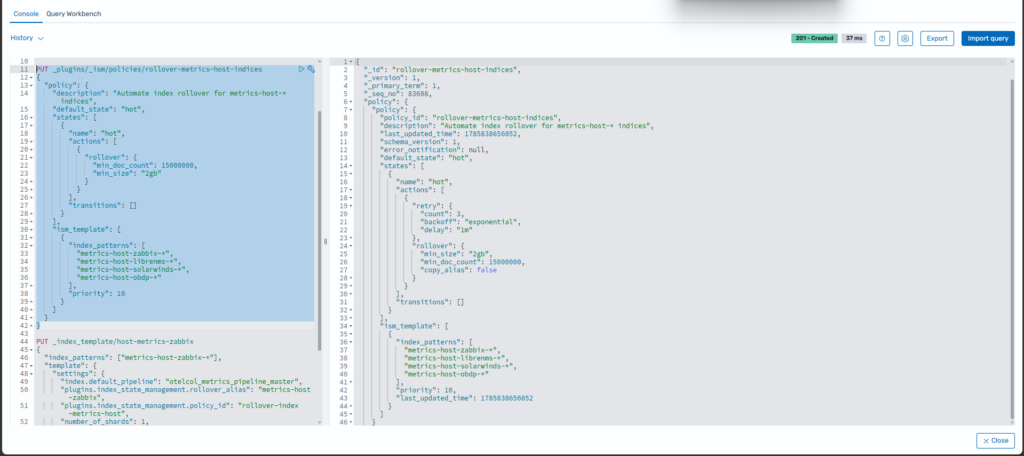
Pertama membuat Index Policy agar index tersebut dapat otomatis rollover ke index baru, contohnya sebagai berikut. Dibawah ini konfigurasi Index Policynya akan rollover dengan 2 kondisi yaitu ketika size 2gb atau doc countnya diangka 15000000.
Jika salah satu kondisinya sudah terpenuhi, maka index akan otomatis rollover.
PUT _plugins/_ism/policies/rollover-metrics-host-indices
{
  "policy": {
    "description": "Automate index rollover for metrics-host-* indices",
    "default_state": "hot",
    "states": [
      {
        "name": "hot",
        "actions": [
          {
            "rollover": {
              "min_doc_count": 15000000,
              "min_size": "2gb"
            }
          }
        ],
        "transitions": []
      }
    ],
    "ism_template": [
      {
        "index_patterns": [
          "metrics-host-zabbix-*",
          "metrics-host-librenms-*",
          "metrics-host-solarwinds-*",
          "metrics-host-obdp-*"
        ],
        "priority": 10
      }
    ]
  }
}
Membuat Ingest Pipeline
Berikut ini adalah template ingest pipeline yang akan melakukan perhitungan untuk merubah nilai dan unit pada data metrics yang valuenya masih dalam bentuk raw, ini sample metrics yang sudah dibuatkan templatenya:
- system.memory.utilization
- system.cpu.utilization
- system.cpu.frequency
- system.memory.usage
- system.filesystem.utilization
- system.filesystem.usage
- system.disk.io
- system.disk.operations
- system.filesystem.inodes.usage
Metrics diatas hanya baru sebagian metrics saja yang sudah dibuatkan ingest pipeline dan untuk melihat list lengkap untuk metrics OpenTelemetry Collector bisa dilihat di githubnya OpenTelemetry atau official website OpenTelemetry
PUT _ingest/pipeline/otelcol_metrics_system-cpu-utilization
{
  "description": "Convert OpenTelemetry system cpu utilization metrics to human-readable percentage",
  "processors": [
    {
      "script": {
        "lang": "painless",
        "ignore_failure": true,
        "source": """
          if (ctx.containsKey('name') && ctx.containsKey('value')) {
            if (ctx.name.contains('system.cpu.utilization')) {
              ctx['value_human'] = Math.round(ctx.value * 10000.0) / 100.0;
              ctx['value_unit'] = '%';
            }
          }
        """
      }
    }
  ]
}

PUT _ingest/pipeline/otelcol_metrics_system-memory-utilization
{
  "description": "Convert OpenTelemetry system memory utilization to percentage",
  "processors": [
    {
      "script": {
        "lang": "painless",
        "ignore_failure": true,
        "source": """
          if (ctx.containsKey('name') && ctx.name == 'system.memory.utilization' && ctx.containsKey('value')) {
            ctx['value_human'] = Math.round(ctx.value * 10000.0) / 100.0;
            ctx['value_unit'] = '%';
          }
        """
      }
    }
  ]
}
PUT _ingest/pipeline/otelcol_metrics_system-cpu-frequency
{
  "description": "Convert OTEL CPU frequency from Hz to GHz",
  "processors": [
    {
      "script": {
        "lang": "painless",
        "ignore_failure": true,
        "source": """
          if (ctx.containsKey('name') && ctx.name == 'system.cpu.frequency' && ctx.containsKey('value')) {
            ctx['value_human'] = Math.round((ctx.value / 1000000000.0) * 100.0) / 100.0;
            ctx['value_unit'] = 'GHz';
          }
        """
      }
    }
  ]
}

PUT _ingest/pipeline/otelcol_metrics_system-memory-usage
{
  "description": "Convert OTEL memory usage from Bytes to GB",
  "processors": [
    {
      "script": {
        "lang": "painless",
        "ignore_failure": true,
        "source": """
          if (ctx.containsKey('name') && ctx.name == 'system.memory.usage' && ctx.containsKey('value')) {
            ctx['value_human'] = Math.round((ctx.value / 1073741824.0) * 100.0) / 100.0;
            ctx['value_unit'] = 'GB';
          }
        """
      }
    }
  ]
}

PUT _ingest/pipeline/otelcol_metrics_system-filesystem-utilization
{
  "description": "Convert OTEL filesystem utilization to percentage",
  "processors": [
    {
      "script": {
        "lang": "painless",
        "ignore_failure": true,
        "source": """
          if (ctx.containsKey('name') && ctx.name == 'system.filesystem.utilization' && ctx.containsKey('value')) {
            ctx['value_human'] = Math.round(ctx.value * 10000.0) / 100.0;
            ctx['value_unit'] = '%';
          }
        """
      }
    }
  ]
}

PUT _ingest/pipeline/otelcol_metrics_system-filesystem-usage
{
  "description": "Convert OTEL filesystem usage from Bytes to GB",
  "processors": [
    {
      "script": {
        "lang": "painless",
        "ignore_failure": true,
        "source": """
          if (ctx.containsKey('name') && ctx.name == 'system.filesystem.usage' && ctx.containsKey('value')) {
            ctx['value_human'] = Math.round((ctx.value / 1073741824.0) * 100.0) / 100.0;
            ctx['value_unit'] = 'GB';
          }
        """
      }
    }
  ]
}

PUT _ingest/pipeline/otelcol_metrics_system-disk-io
{
  "description": "Convert OTEL disk IO from Bytes to GB",
  "processors": [
    {
      "script": {
        "lang": "painless",
        "ignore_failure": true,
        "source": """
          if (ctx.containsKey('name') && ctx.name == 'system.disk.io' && ctx.containsKey('value')) {
            ctx['value_human'] = Math.round((ctx.value / 1073741824.0) * 100.0) / 100.0;
            ctx['value_unit'] = 'GB';
          }
        """
      }
    }
  ]
}

PUT _ingest/pipeline/otelcol_metrics_system-disk-operations
{
  "description": "Format OTEL disk operations count",
  "processors": [
    {
      "script": {
        "lang": "painless",
        "ignore_failure": true,
        "source": """
          if (ctx.containsKey('name') && ctx.name == 'system.disk.operations' && ctx.containsKey('value')) {
            ctx['value_human'] = ctx.value;
            ctx['value_unit'] = 'Ops';
          }
        """
      }
    }
  ]
}

PUT _ingest/pipeline/otelcol_metrics_system-filesystem-inodes-usage
{
  "description": "Format OTEL filesystem inodes usage count",
  "processors": [
    {
      "script": {
        "lang": "painless",
        "ignore_failure": true,
        "source": """
          if (ctx.containsKey('name') && ctx.name == 'system.filesystem.inodes.usage' && ctx.containsKey('value')) {
            ctx['value_human'] = ctx.value;
            ctx['value_unit'] = 'Inodes';
          }
        """
      }
    }
  ]
}
Membuat ingest Pipeline Master
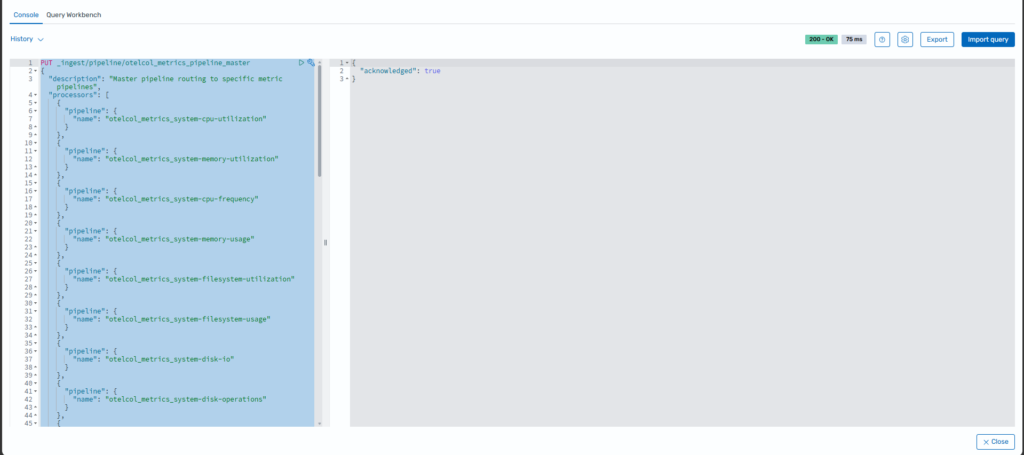
Dikarenakan sebelumnya sudah membuat pipeline untuk melakukan konversi untuk masing-masing metrik, sekarang kita butuh satu pipeline utama sebagai pengaturnya (routing).
Master pipeline ini akan kita masukkan ke Index Template agar setiap indeks baru yang terbentuk dari proses rollover bisa otomatis membaca dan mengeksekusi aturan konversi tersebut.
PUT _ingest/pipeline/otelcol_metrics_pipeline_master
{
  "description": "Master pipeline routing to specific metric pipelines",
  "processors": [
    {
      "pipeline": {
        "name": "otelcol_metrics_system-cpu-utilization"
      }
    },
    {
      "pipeline": {
        "name": "otelcol_metrics_system-memory-utilization"
      }
    },
    {
      "pipeline": {
        "name": "otelcol_metrics_system-cpu-frequency"
      }
    },
    {
      "pipeline": {
        "name": "otelcol_metrics_system-memory-usage"
      }
    },
    {
      "pipeline": {
        "name": "otelcol_metrics_system-filesystem-utilization"
      }
    },
    {
      "pipeline": {
        "name": "otelcol_metrics_system-filesystem-usage"
      }
    },
    {
      "pipeline": {
        "name": "otelcol_metrics_system-disk-io"
      }
    },
    {
      "pipeline": {
        "name": "otelcol_metrics_system-disk-operations"
      }
    },
    {
      "pipeline": {
        "name": "otelcol_metrics_system-network-io"
      }
    },
    {
      "pipeline": {
        "name": "otelcol_metrics_system-network-io"
      }
    }
  ]
}
Check Ingest Pipeline
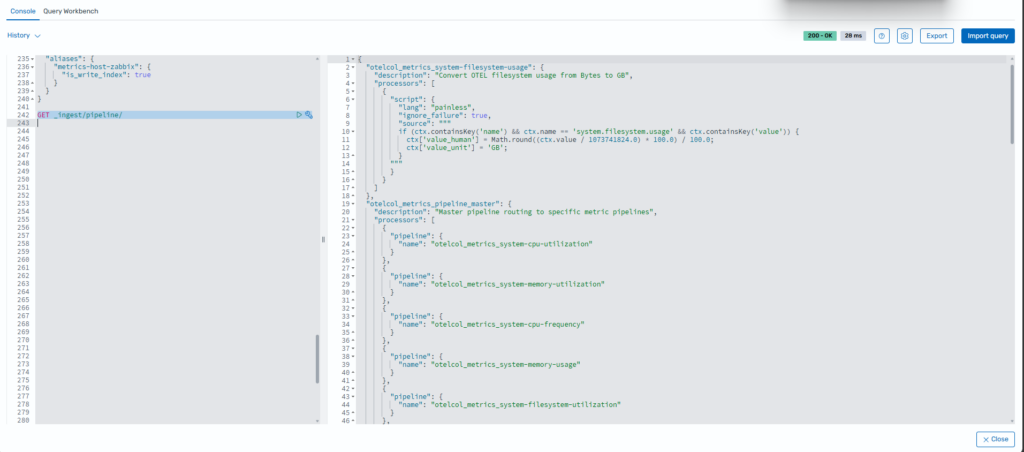
Setelah itu check list ingest pipeline dengan query berikut:
GET _ingest/pipeline/
Membuat Index Template
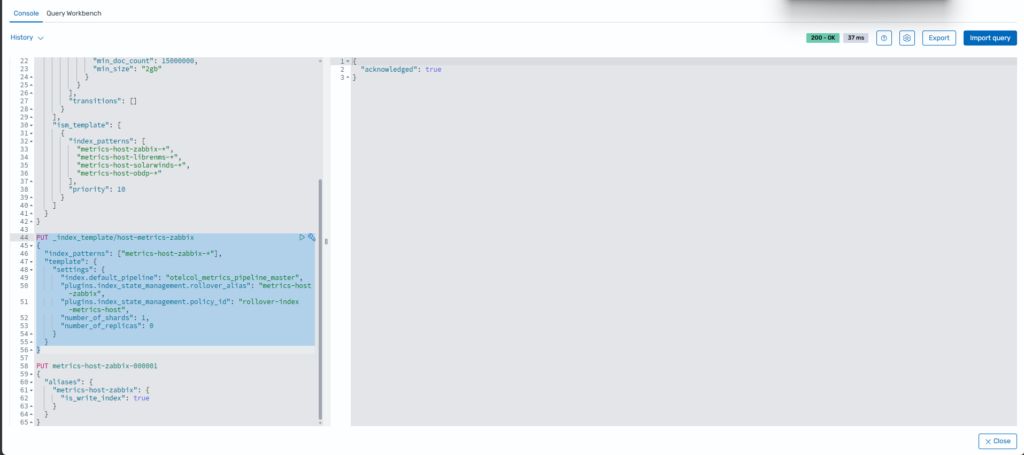
Selanjutnya buat index template yang didalamnya sudah ada ingest pipeline, policy id dan index alias.
PUT _index_template/host-metrics-zabbix
{
  "index_patterns": ["metrics-host-zabbix-*"],
  "template": {
    "settings": {
      "index.default_pipeline": "otelcol_metrics_pipeline_master",
      "plugins.index_state_management.rollover_alias": "metrics-host-zabbix",
      "plugins.index_state_management.policy_id": "rollover-index-metrics-host",
      "number_of_shards": 1,
      "number_of_replicas": 0
    }
  }
}
Membuat Index
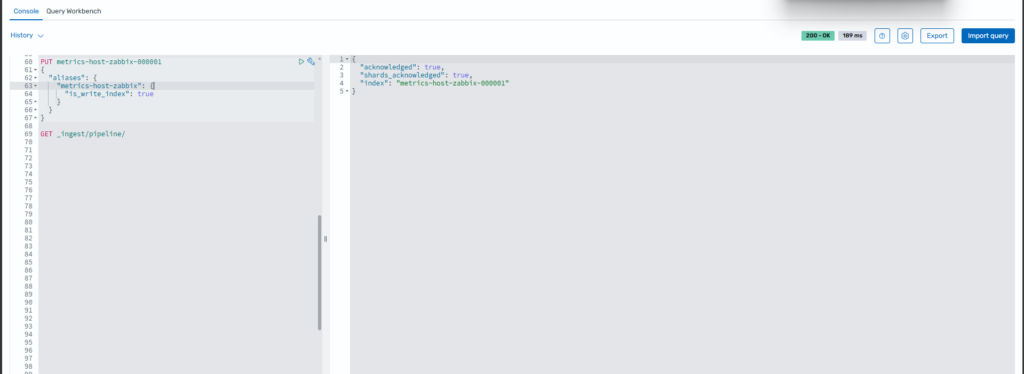
Berikutnya membuat index pertama dengan menambahkan index alias.
PUT metrics-host-zabbix-000001
{
  "aliases": {
    "metrics-host-zabbix": {
      "is_write_index": true
    }
  }
}
Konfigurasi Pipeline Dataprepper
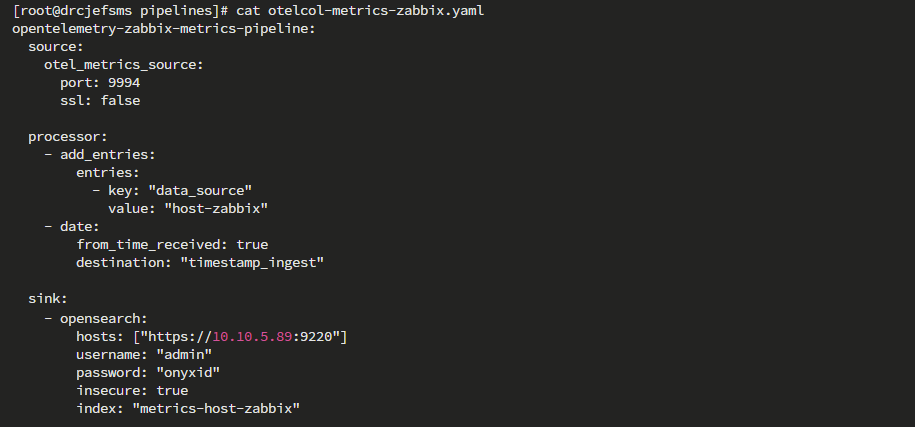
Setelah itu lakukan konfigurasi dataprepper dan arahkan outputnya ke index alias.
opentelemetry-zabbix-metrics-pipeline:
  source:
    otel_metrics_source:
      port: 9994
      ssl: false

  processor:
    - add_entries:
        entries:
          - key: "data_source"
            value: "host-zabbix"
    - date:
        from_time_received: true
        destination: "timestamp_ingest"

  sink:
    - opensearch:
        hosts: ["https://10.10.5.89:9220"]
        username: "admin"
        password: "onyxid"
        insecure: true
        index: "metrics-host-zabbix"
Check Data Metrics di Index
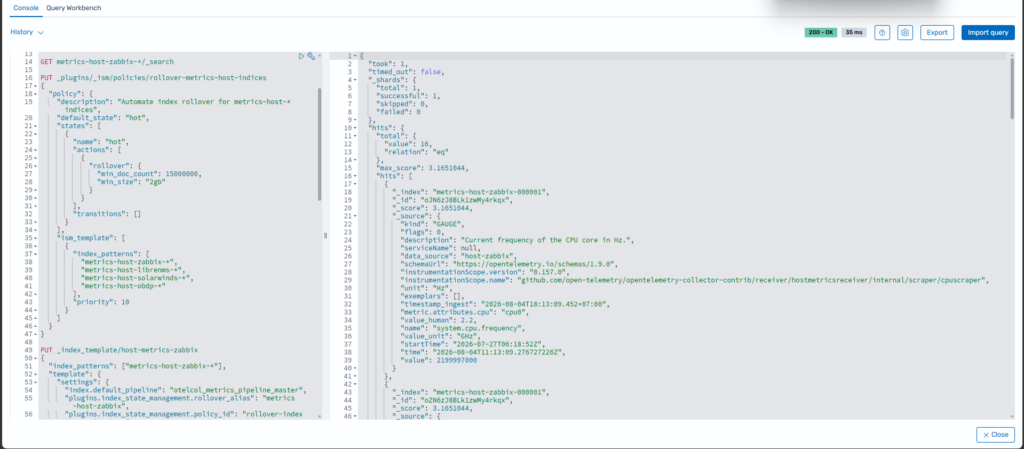
Setelah dicheck, value dan unitnya sudah berubah menjadi value dalam bentuk Ghz.
GET metrics-host-zabbix-*/_search
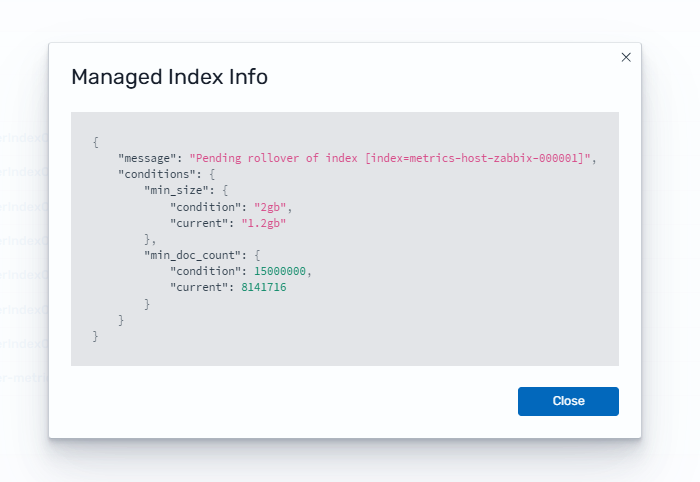
Lalu ketika di check indexnya masih belum melakukan rollover, untuk pengecekan pertama bisa melalui menu Policy managed indexes. Disana akan terlihat status policy rollover sedang mengalami failed atau sedang running
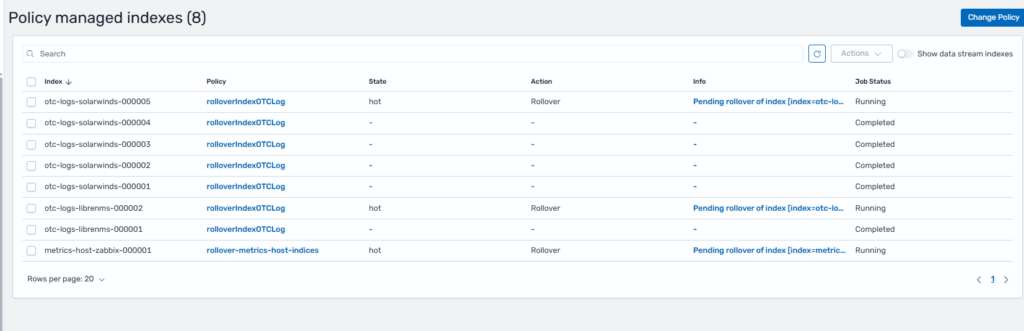
Ketika kolom info di klik, maka akan muncul informasi kenapa index rollover tersebut masih pending.